What Analysts Actually Do All Day
Discover why analysts spend 80% of their time playing data plumber, and how Limelight eliminates this friction to get from question to query instantly.

1. Executive Summary & Key Implications for Leaders
Analysts are hired to uncover hidden revenue opportunities and guide strategy, yet industry surveys reveal they spend 60% to 80% of their time on data preparation—hunting datasets, deciphering schemas, and debugging broken joins. This blog explores how Limelight's automated relationship mapping engine eliminates this "data tax," instantly translating business questions into ready-to-use queries and letting your team focus on actual analysis.
Key ROI Implications for Leaders:
- Reclaim Analyst Time: Eliminate hours spent manually exploring schemas and writing repetitive joins.
- Accelerate Time-to-Insight: Answer complex business questions in seconds, not after days of data wrangling.
- Maximize Talent Value: Allow your best analytical minds to focus on strategy and trends instead of playing data plumber.
- Democratize Data Access: Reduce the bottleneck on your data team by making baseline dataset assembly automatic.
The 80% Data Tax: Why Your Best Analysts Are Stuck Playing Plumber
Before a single insight can be drawn, data must be wrestled into submission. Business data rarely arrives clean or connected; it is scattered across fractured databases, CRMs, and rigid spreadsheets.
This isn't a secret. Data preparation acts as a massive bottleneck, consuming the vast majority of an analyst’s time. As one analyst described their workflow:
Most of my time is spent pulling data from different sources and trying to get it into a usable form.
Another explained the grueling steps behind even simple leadership requests:
You start with a question, then spend time figuring out which tables to use, writing queries, debugging joins, and checking if the numbers match.
Companies are awash in data but struggle to turn it into actionable insight. Operations stall not from a lack of talent or information, but because of the immense friction required to simply assemble a baseline dataset.
How Limelight Unblocks the Analyst
Limelight is built to remove the hours analysts lose navigating schemas and tracing table relationships. Instead of forcing a human to manually figure out how dozens of tables connect, Limelight does the heavy lifting instantly.
Here is how Limelight's engine works to eliminate the data tax:
1. Unified Data Finding
The first hurdle in any analysis is simply locating the right data. Analysts often spend hours searching across disparate systems just to find the relevant tables. Limelight's unified search engine and out-of-the-box connectors integrate directly with your existing infrastructure. This allows analysts to instantly search and access all necessary data from a single centralized interface.
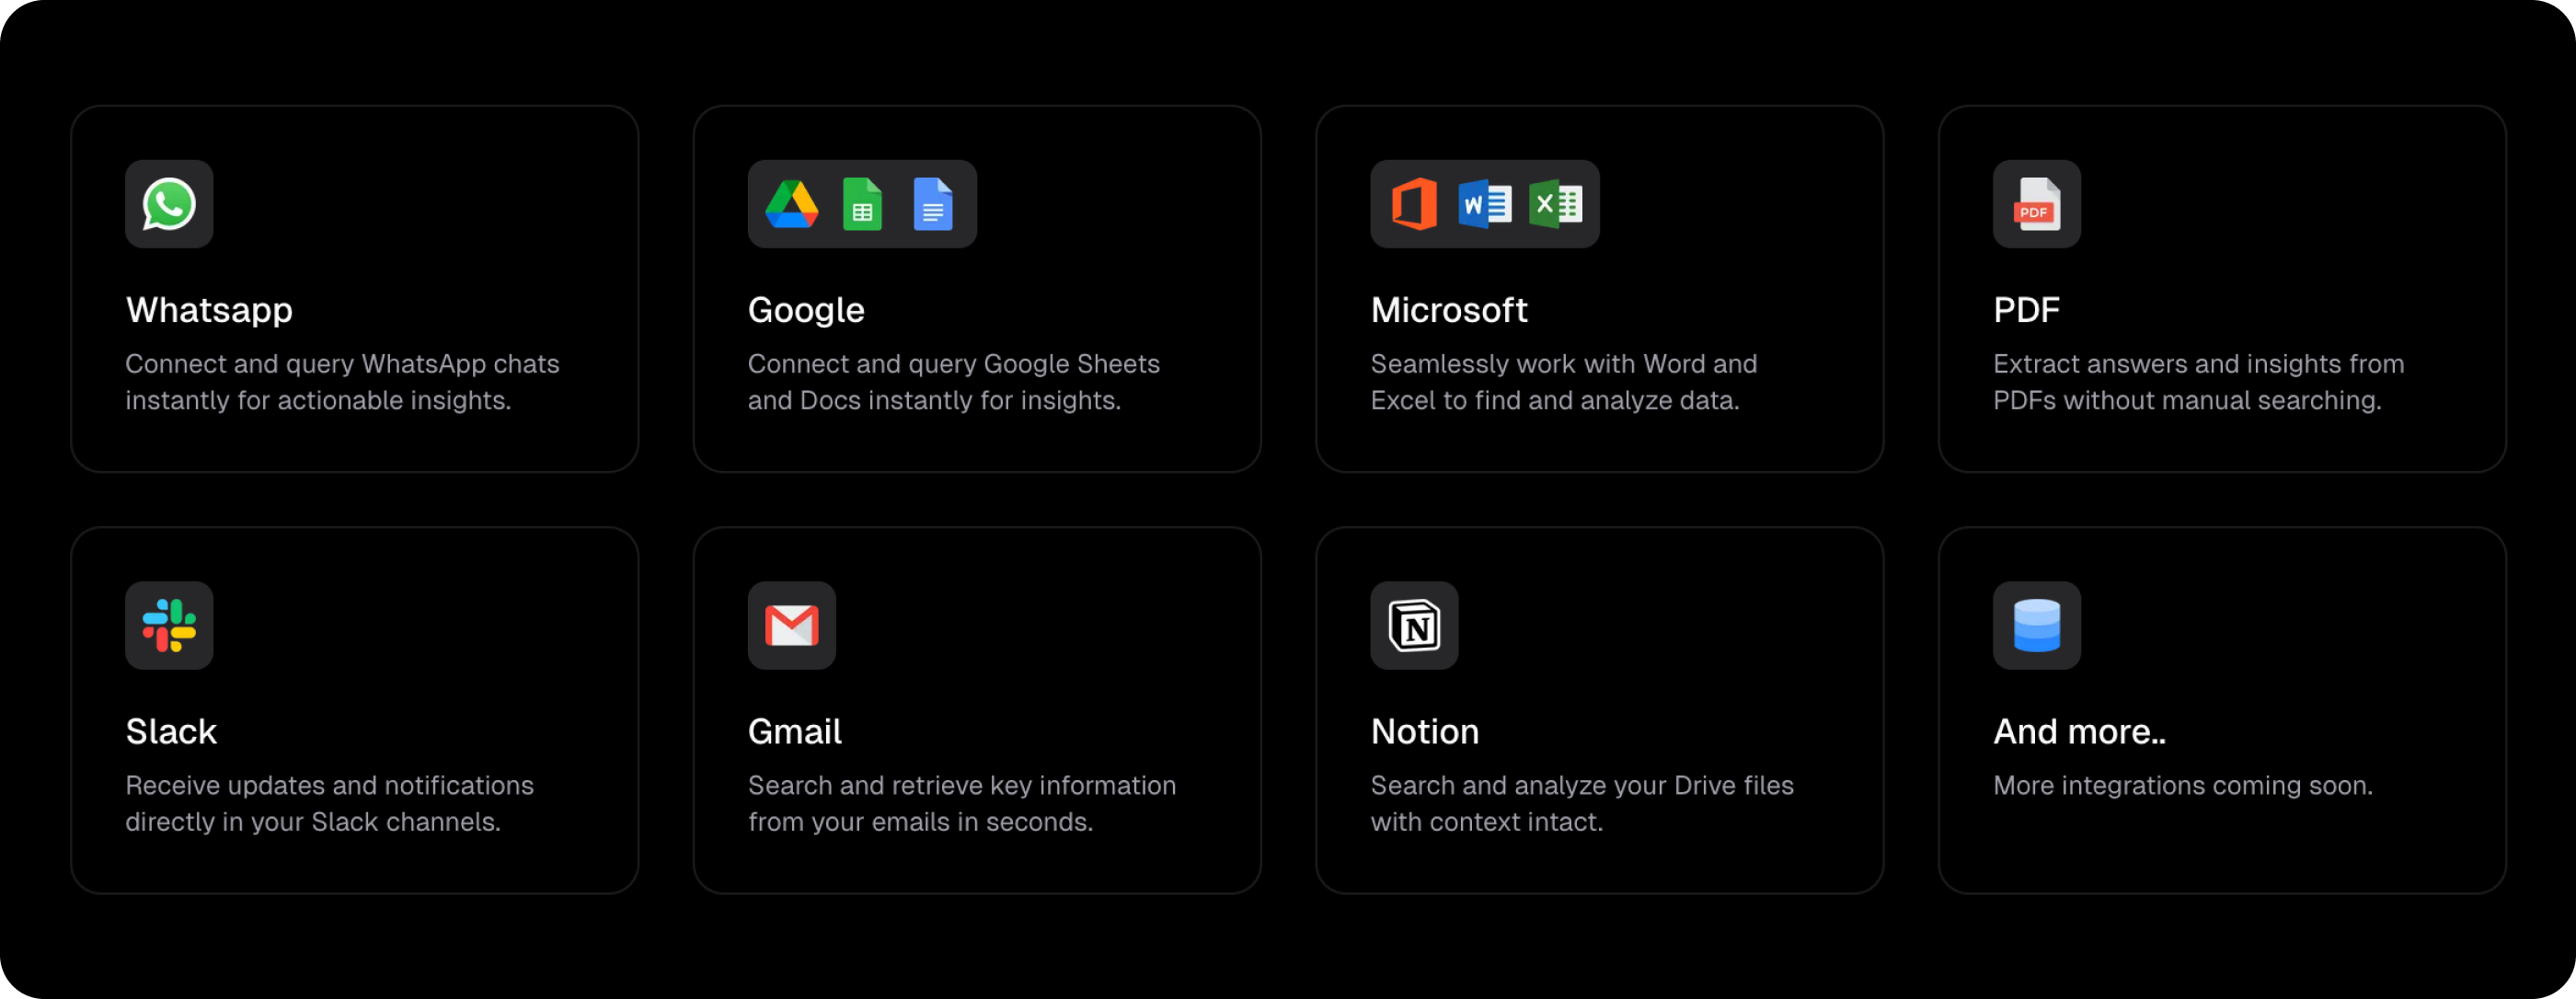
Search across all your connected databases and SaaS platforms from one place.
2. Automated Data Cleanup
Raw business data is inherently messy and filled with varied formats or typos. Before querying, analysts traditionally write regex scripts or manually sanitize records. Limelight's data cleaning engine tackles this upfront. It dynamically profiles data, standardizes formats, and normalizes values so downstream queries operate on reliable datasets without manual wrangling.
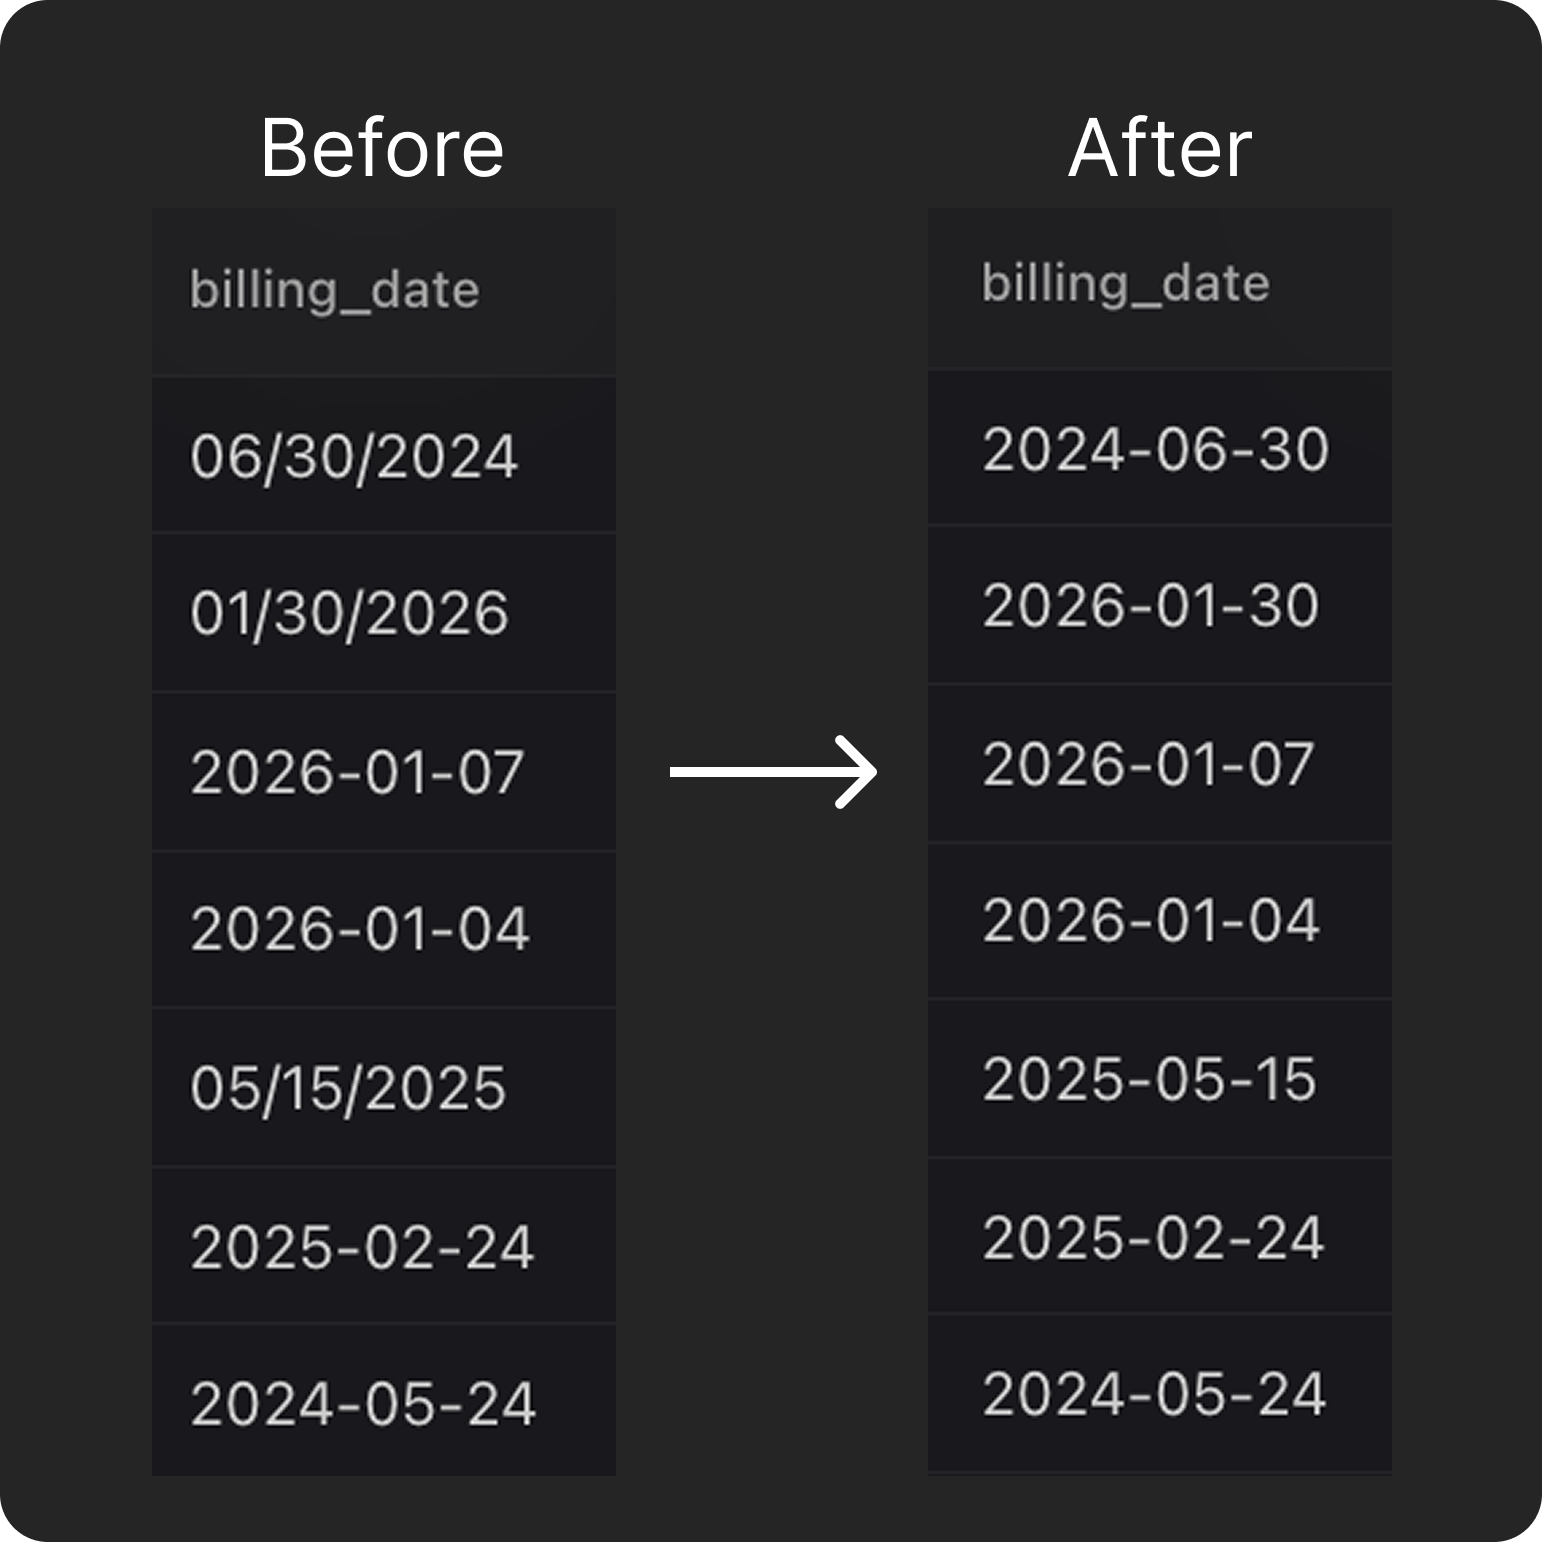
Limelight automatically detects inconsistencies and standardizes messy data for query use.
3. Automated Relationship Mapping & Join Resolution
Instead of starting every analysis by exploring documentation (or lack thereof), Limelight automatically analyzes the structure of your database. It builds a comprehensive relationship map, understanding exactly how tables correlate and resolving the complex web of foreign keys and implicit relationships.
By navigating this labyrinth automatically, Limelight ensures that query paths are logically sound and optimized—eliminating the notorious "broken join" debugging phase that stalls most analytical projects.
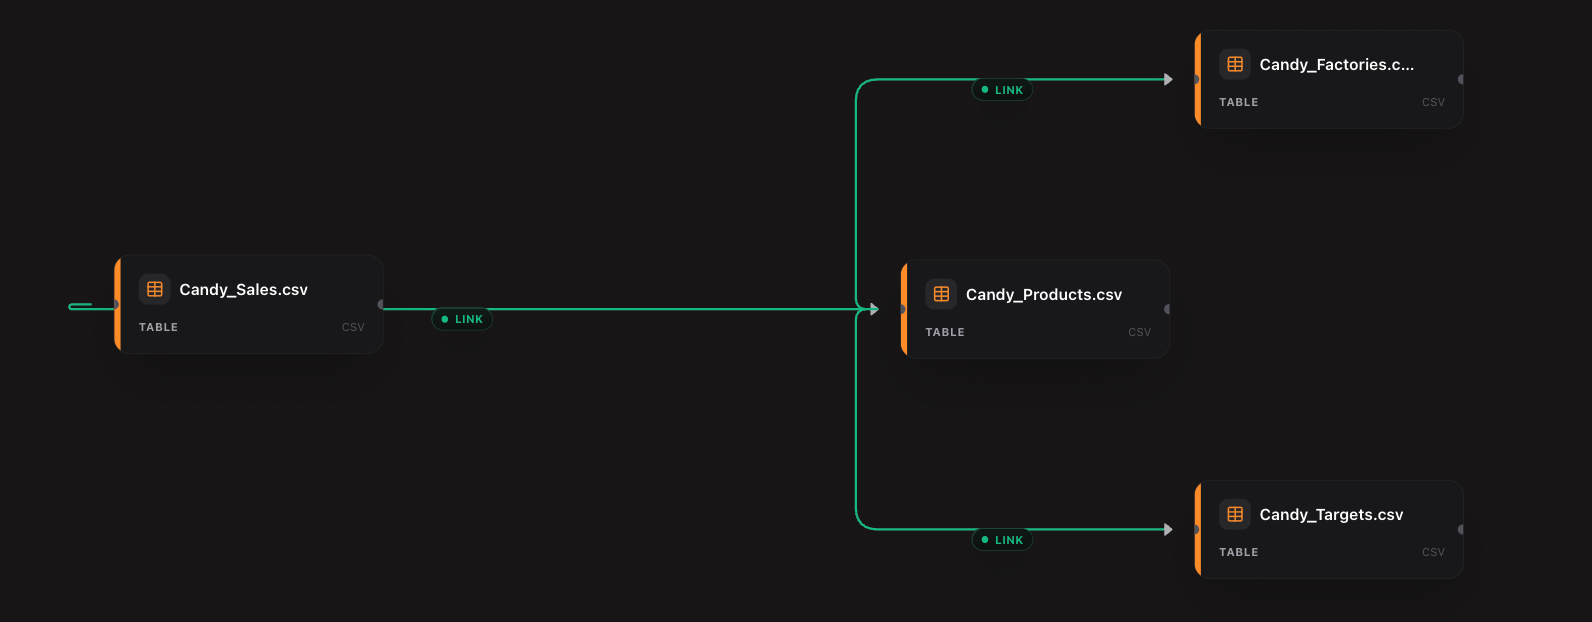
Limelight automatically infers schema relationships, building a comprehensive visual map of your data and resolving join paths.
4. Deep Dive: The End of the Manual Join
Consider a complex, multi-step business question: “What would be the impact on gross profit if we reallocated 30% of sales effort from the lowest-performing region to the two highest-performing regions, assuming the same product mix and current revenue-per-unit efficiency?”
In a traditional workflow, this doesn’t take 15 minutes. It’s typically a 4-to-6 hour project involving:
- Data Sourcing (1-2 hrs): Hunting down sales logs, regional overhead tables, and cost-of-goods-sold across disparate databases.
- Normalization (1 hr): Syncing conflicting regional identifiers and cleaning "sales effort" metrics.
- Analytical Modeling (2-3 hrs): Writing and debugging the multi-step CTEs required to simulate the 30% shift while maintaining product mix logic.
By the time the code below is even drafted, half a work day has already vanished into data plumbing:
-- Traditional Workflow: Multi-step modeling with massive joins & metrics
WITH regional_performance AS (
    SELECT region, SUM(revenue) as rev, SUM(cost) as costs
    FROM sales_data
    GROUP BY 1
),
reallocation_model AS (
    -- Identifying lowest and highest performers...
    -- Calculating 30% shift...
    -- Re-calculating hypothetical gross profit...
)
SELECT * FROM reallocation_model;
The Limelight Reveal: Instead of hours of manual modeling, Limelight's engine performs a multi-step "Technical Pathfind" in seconds:
- Intent Extraction: Parses the 30% reallocation logic and identifies
gross profitandrevenue-per-unitas the target metrics. - Schema Pathfinding: Instantly connects regional sales data, product tables, and cost structures.
- Impact Synthesis: Generates the exact analytical model and computes the results.
Limelight handles the high-level logic, mapping the internal schema to answer complex reallocation questions instantly.
The True ROI: More Time for Actual Analysis
Automating the data plumbing doesn’t replace analysts; it empowers them. It removes the repetitive, low-value work that slows down your operations.
Instead of spending an hour assembling datasets, analysts can immediately focus on higher-value work:
- Exploring new trends and market opportunities
- Investigating anomalies in user behavior
- Validating business hypotheses
- Communicating strategic insights to leadership
In practice, questions that once required hours of preparation can be answered in seconds. The result isn’t a smaller data team; it’s a team that can finally spend their time actually doing analysis.
Conclusion
The friction between raw data and actionable insight is exactly why the 80% data tax exists. By automating schema traversal and query generation, Limelight eliminates the bottleneck that keeps your analysts stuck playing data plumber.
Empower your data team to do what they do best: finding the insights that drive your business forward.